The American Institute of Architects has published the October 2013 Architecture Billing Index (ABI.) For those unfamiliar with the index, anything above 50.0 in a particular sector indicates growth. We’ve seen a lot of ups and downs in both the south and in my area of primary focus, residential design, however things have been slowly and steadily improving over the past six or so months. I always find the infographics supplied to be more interesting than the articles themselves, so without further ado, graphs, data, charts, etc!
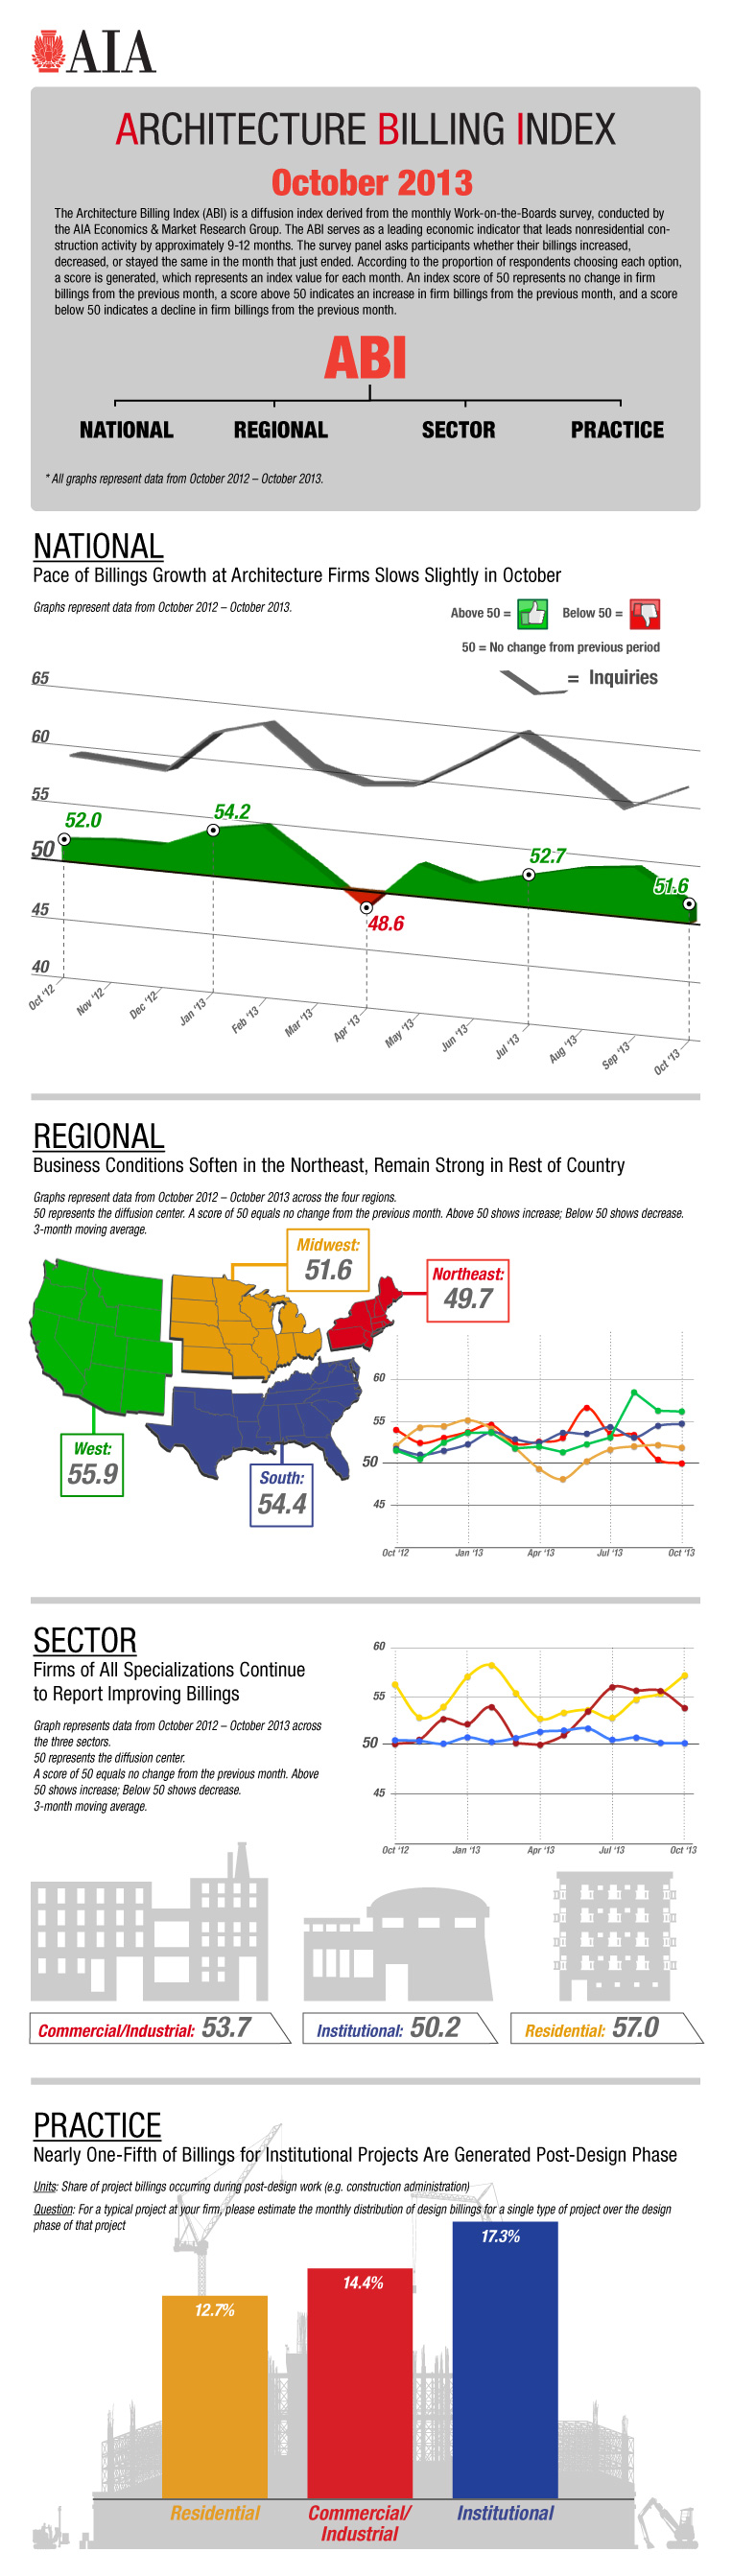
Architecture Billings Index – October 2013 – image credit: American Institute of Architects
So what does it all mean? Things aren’t in a great place, certainly not by boom standards, but they’re doing slowly and consistently better. A few key takeaways:
- The government shutdown in October had an impact on the building industry, but not nearly as severe as it would have been had the shutdown extended longer than it did.
- A shortage of specialized subcontractors is resulting in increased construction costs.
- Multifamily residential, particularly apartments, has dropped off, while single family residential seems to have found a slow, but slightly more steady ‘new normal.’
- The pace of growth has moderated some since the September ABI report.
As we pass into and through the holidays, I expect to see the spring boost in both inquiries and billings, as potential clients seek to kick off design for new projects ahead of the spring / summer peak construction season.